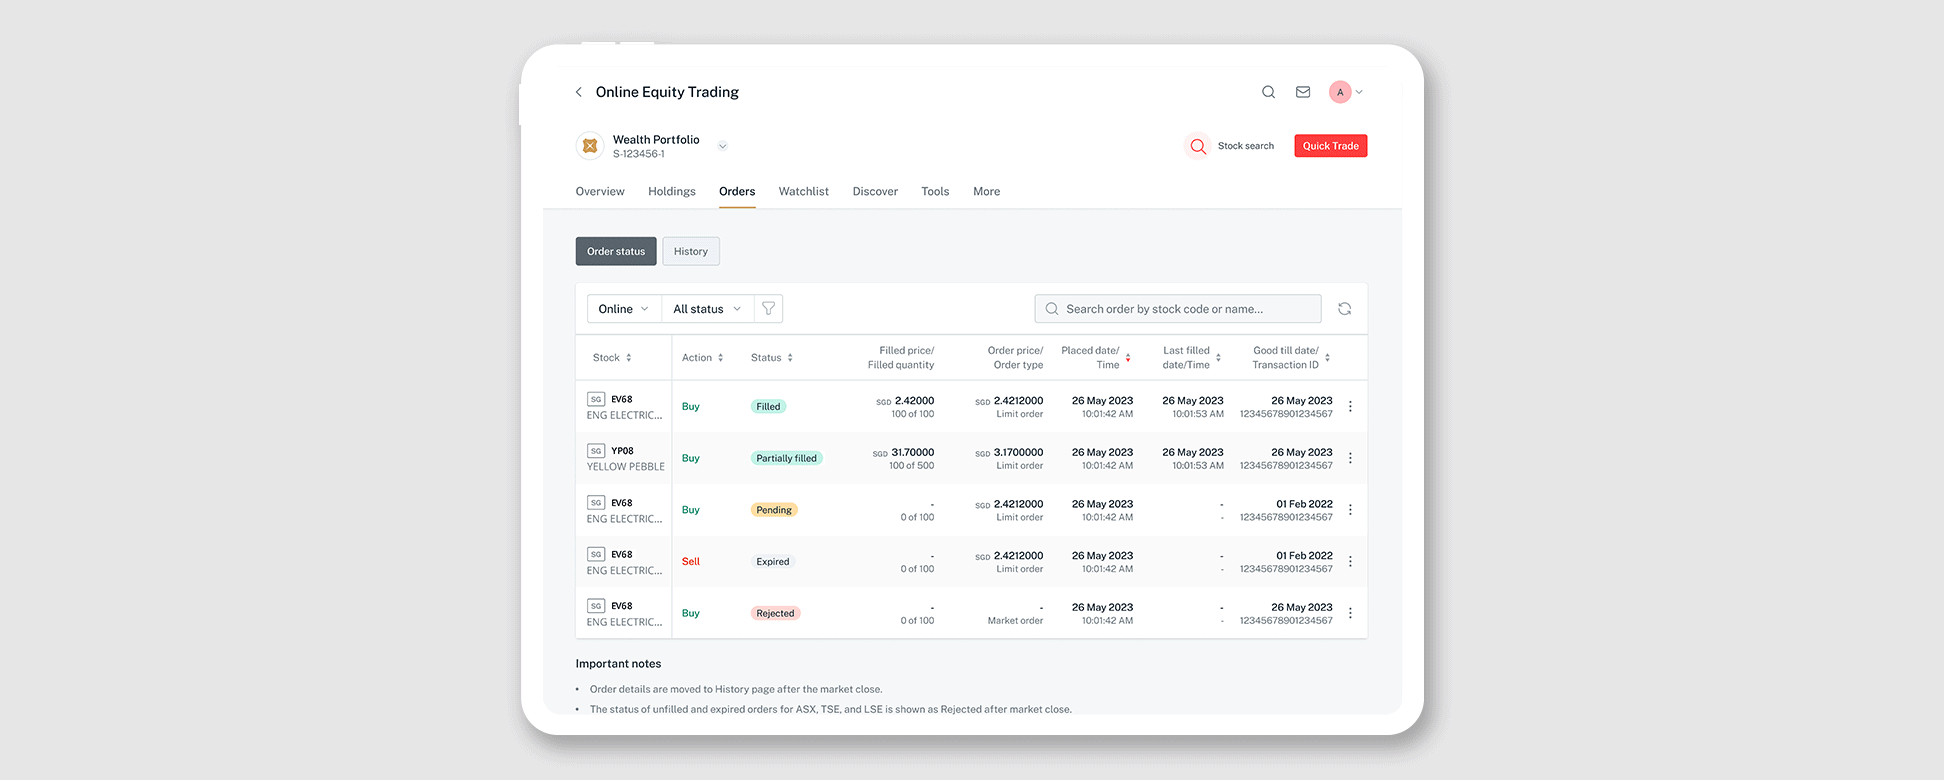
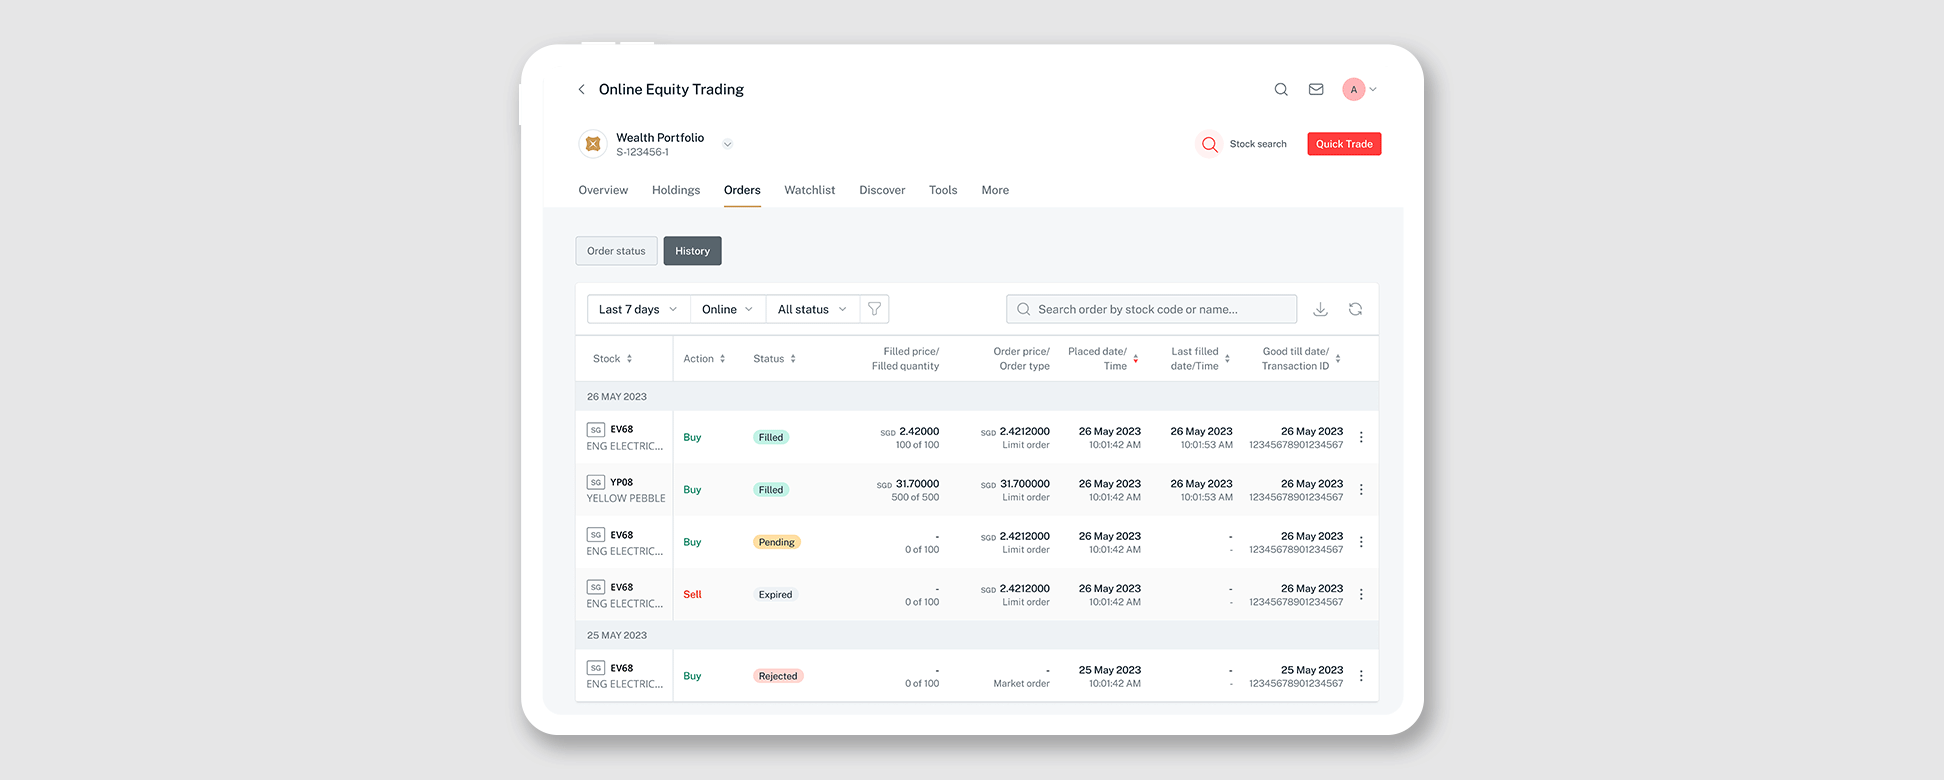
Online Equity Trading
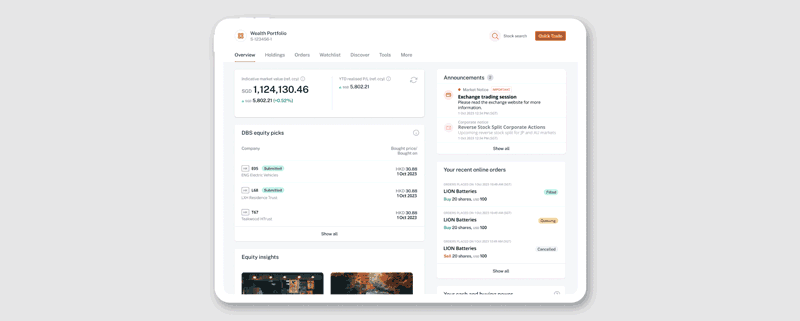
Stay on top of opportunities
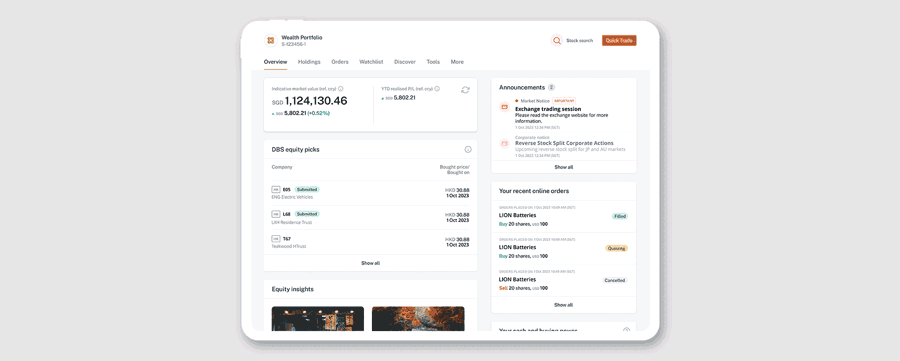
Get the latest market insights, news and DBS equity picks.

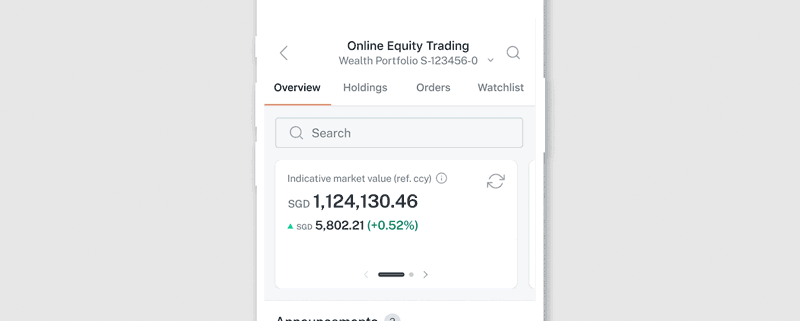
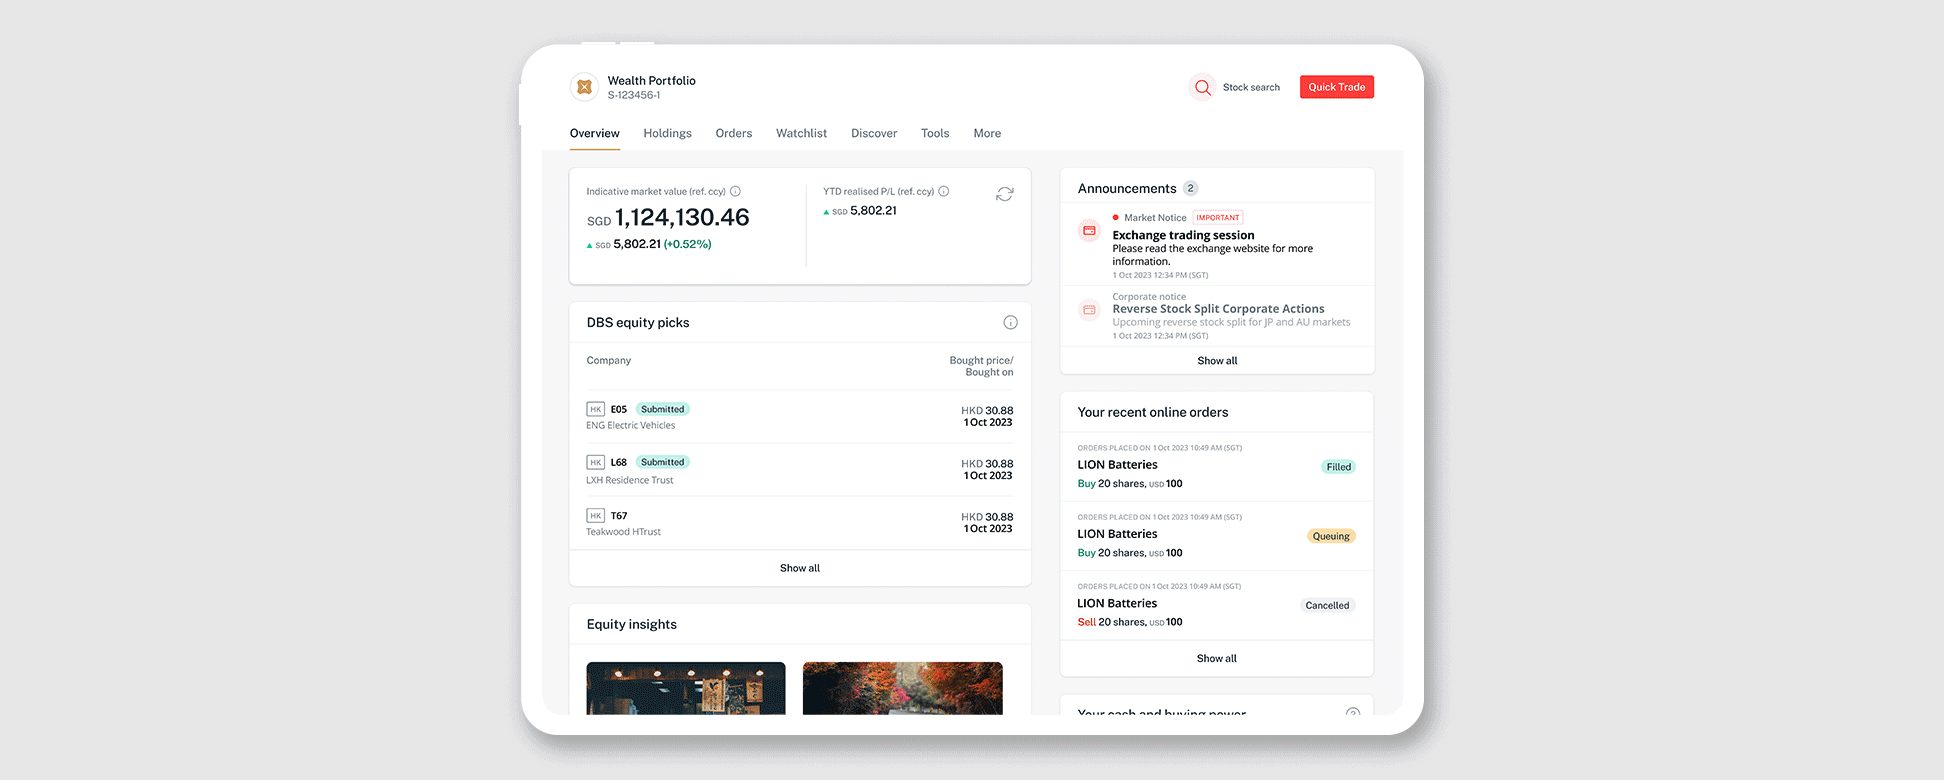
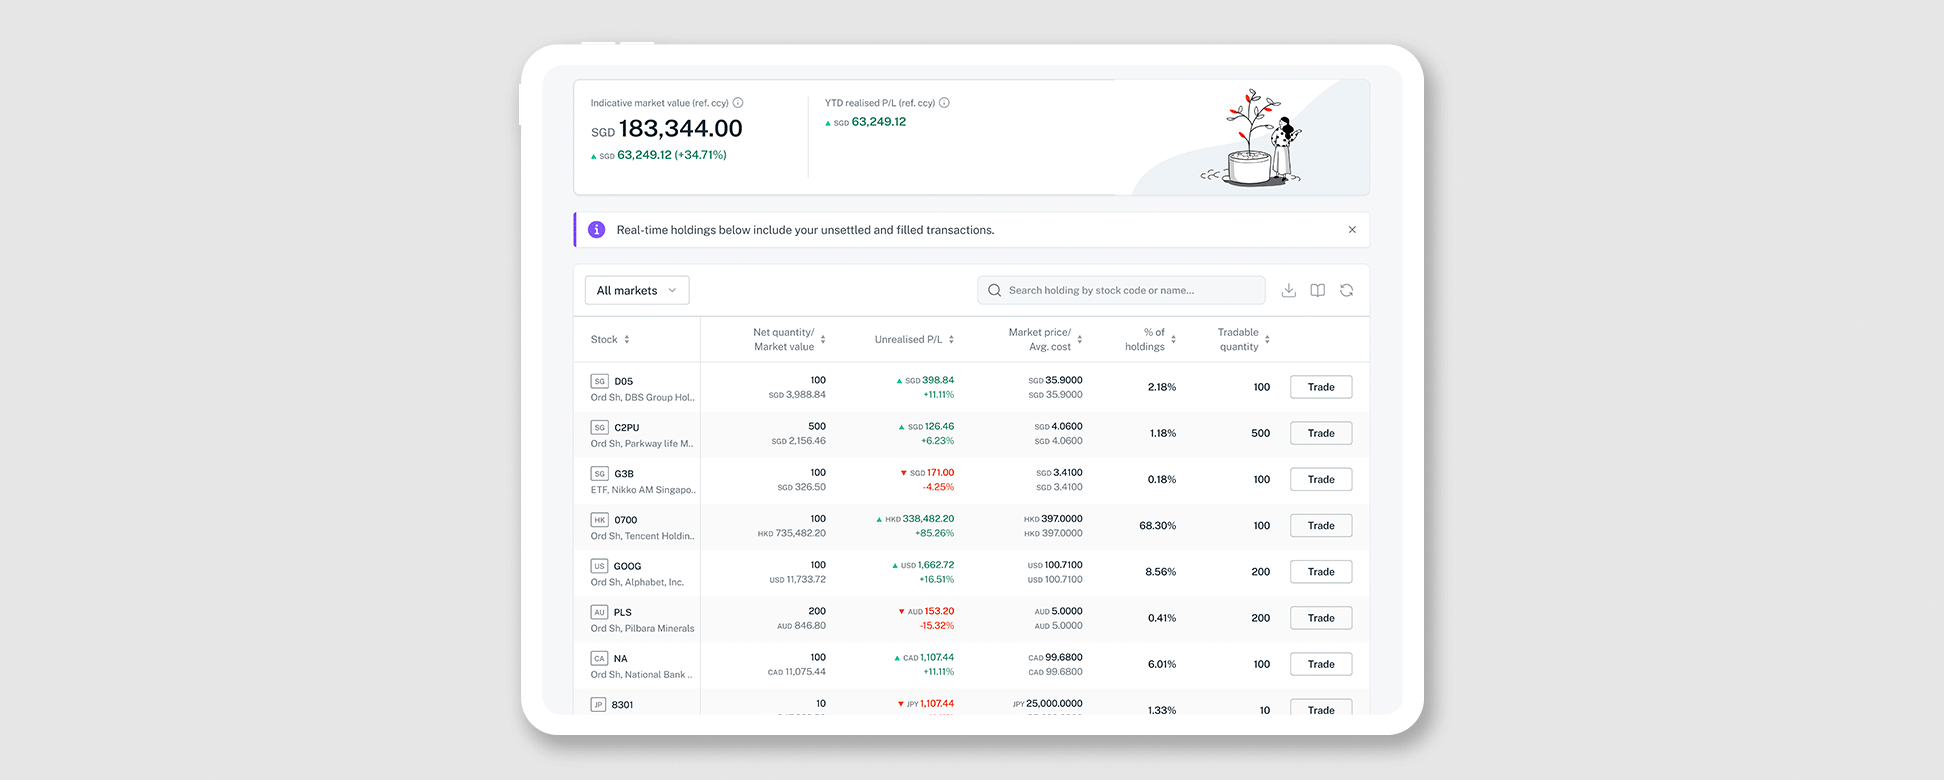
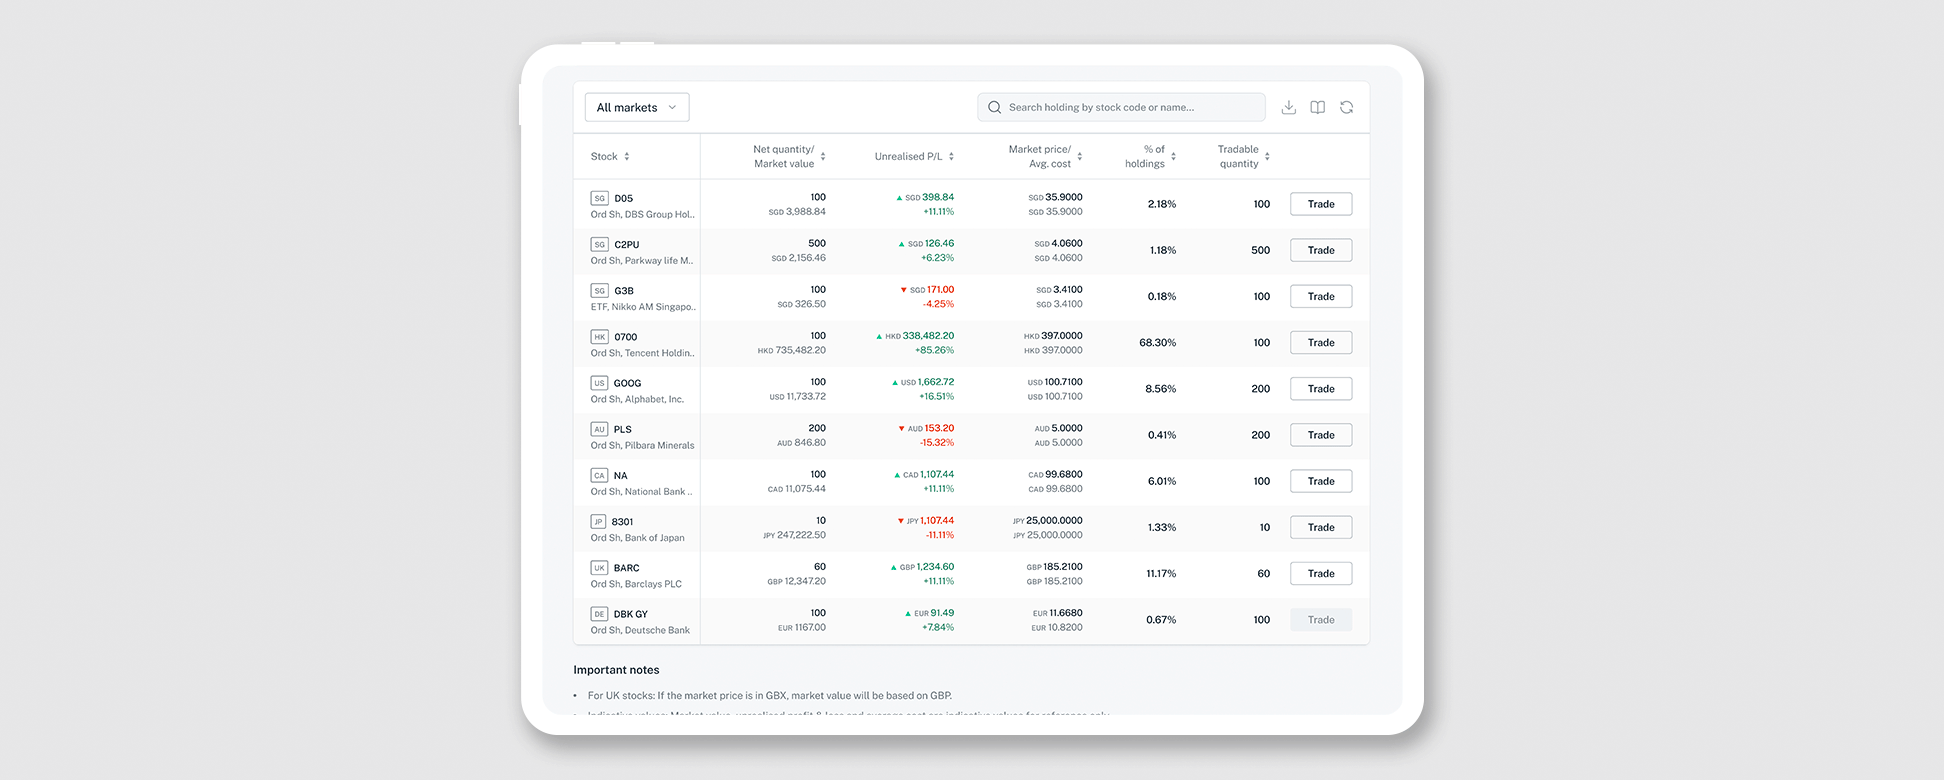
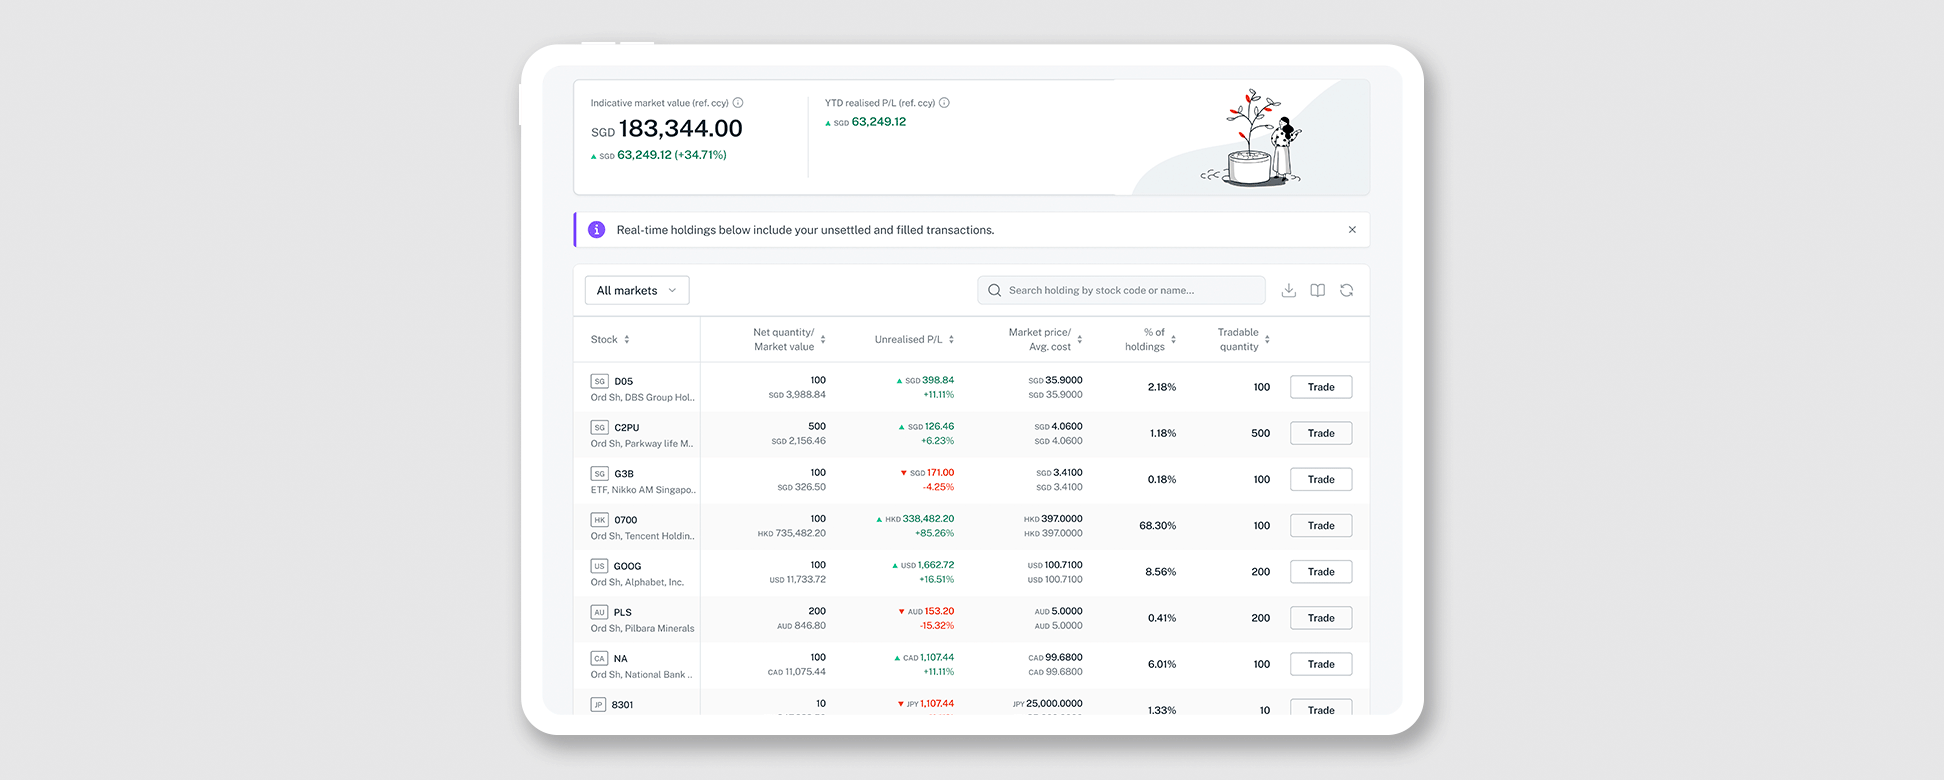
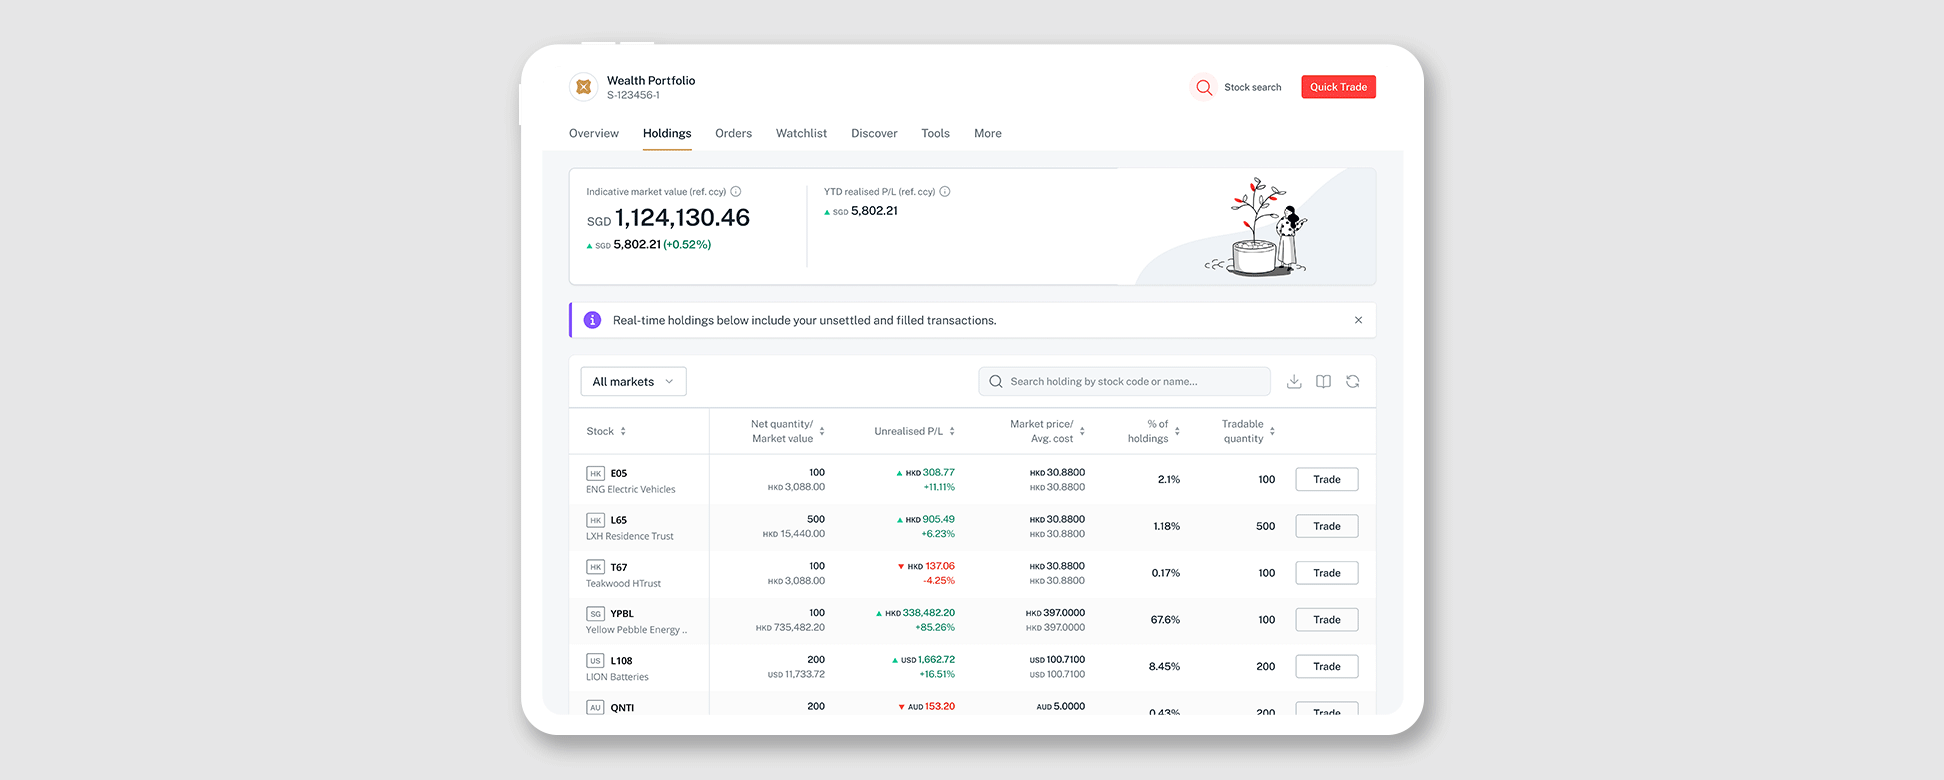
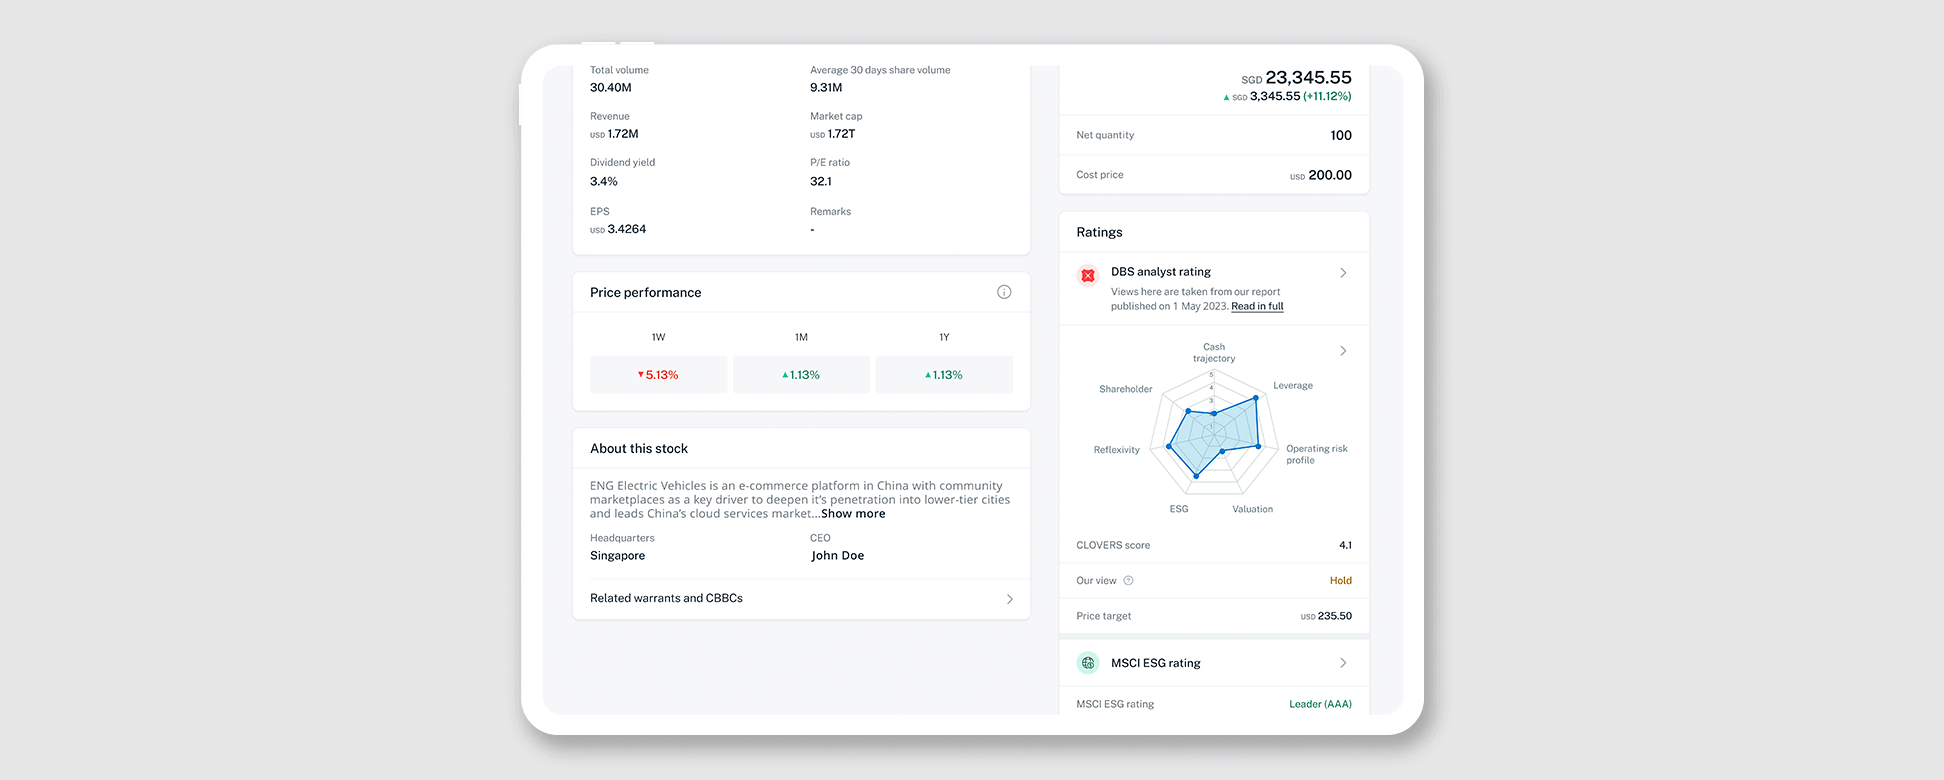
View Indicative Market Value and YTD realised P&L on one screen.
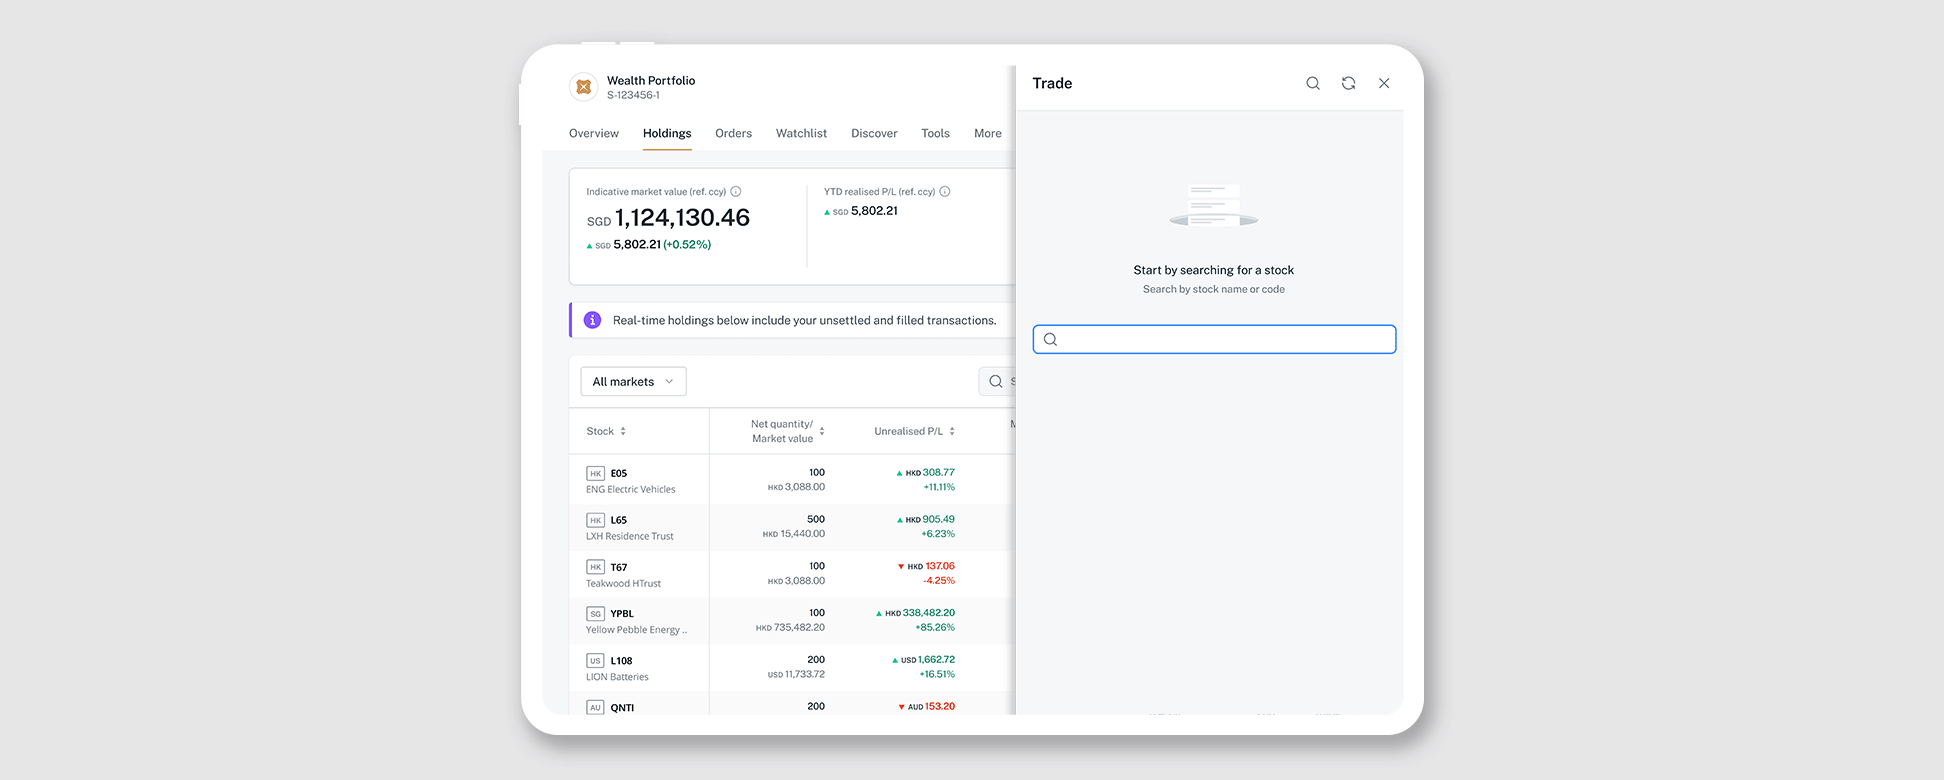
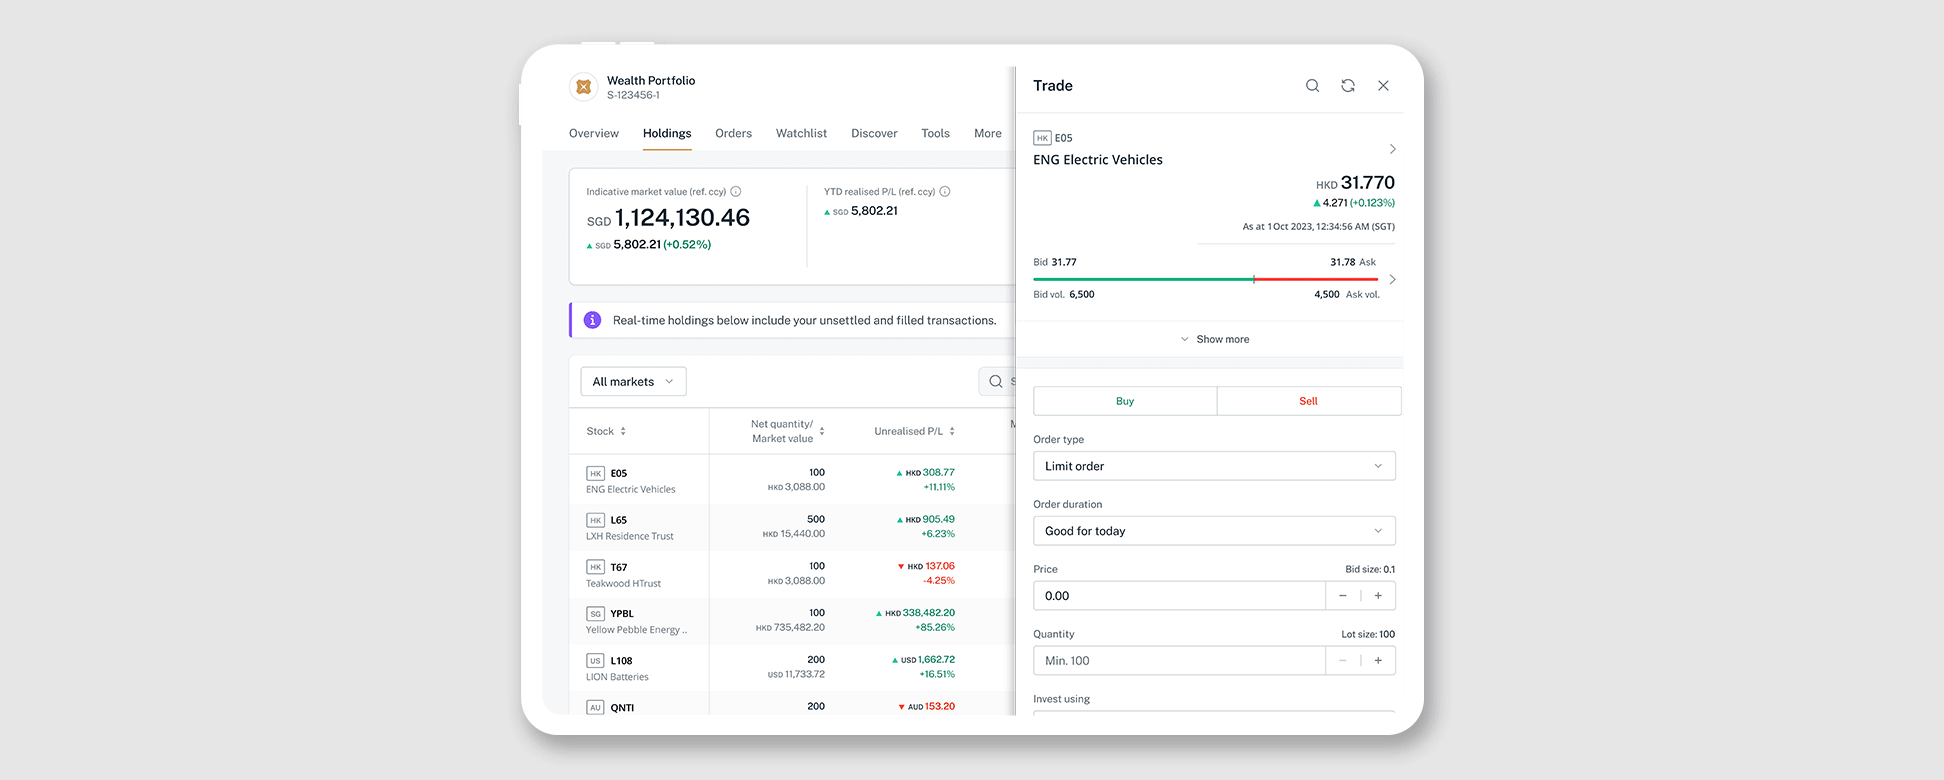
Tap on Quick Trade to slide open trade drawer.
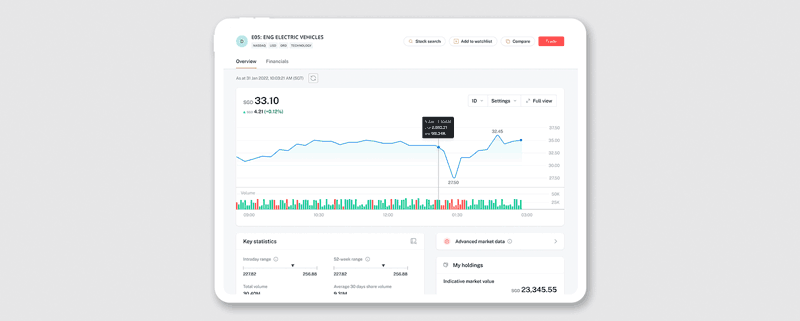
See data and insights on a stock in one view.

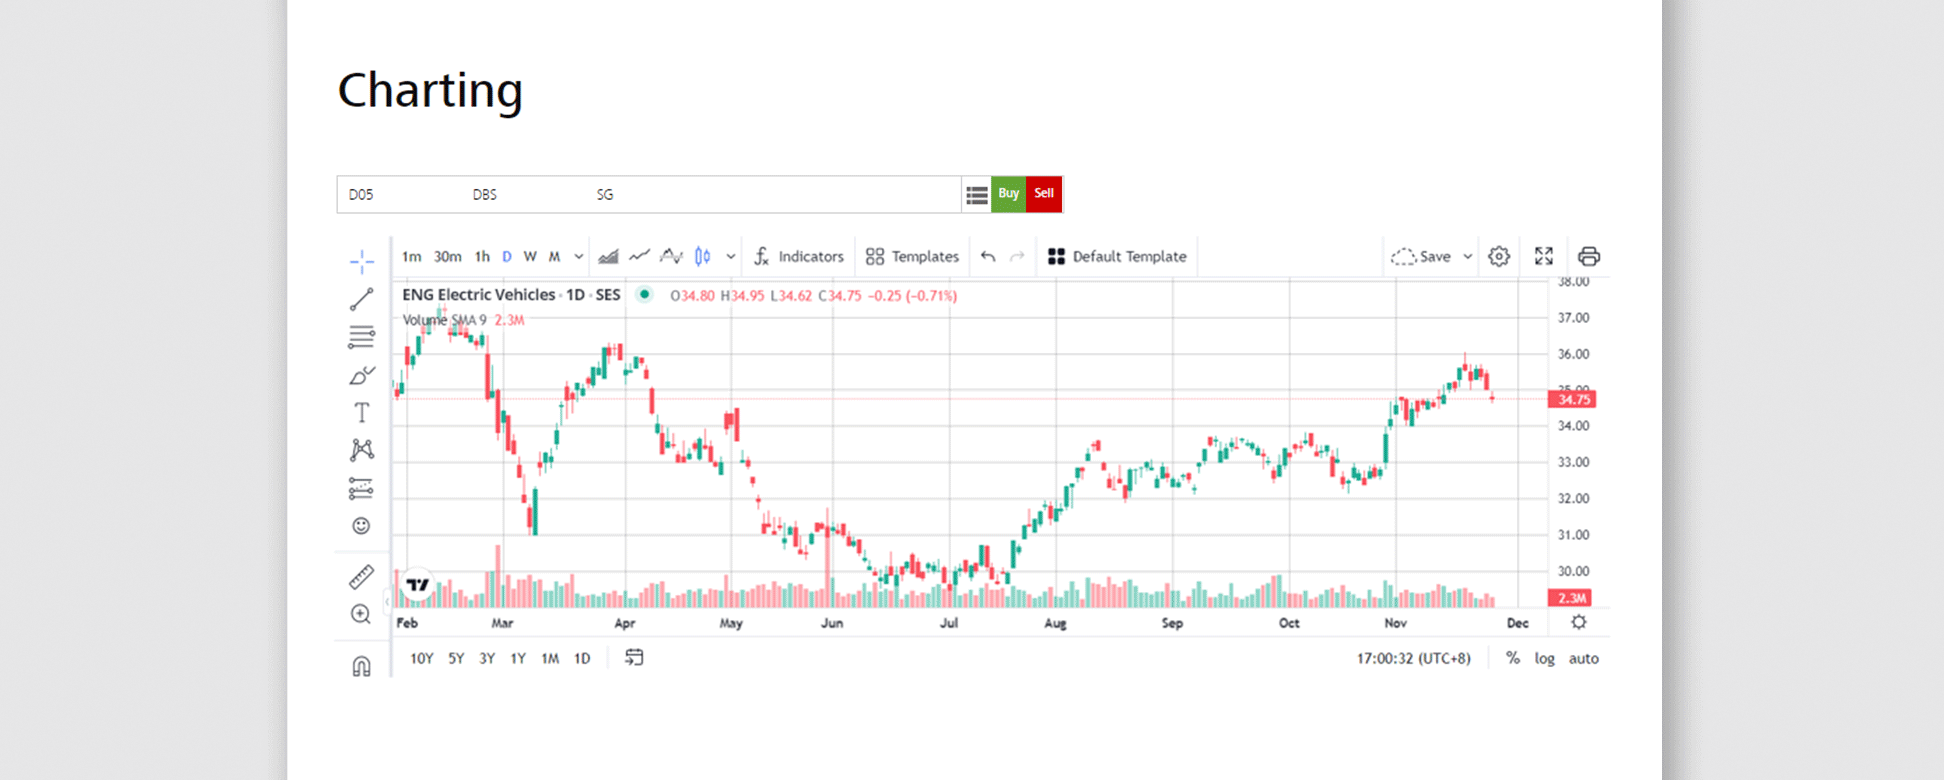
Analyse data points with customisable tools and indicators.
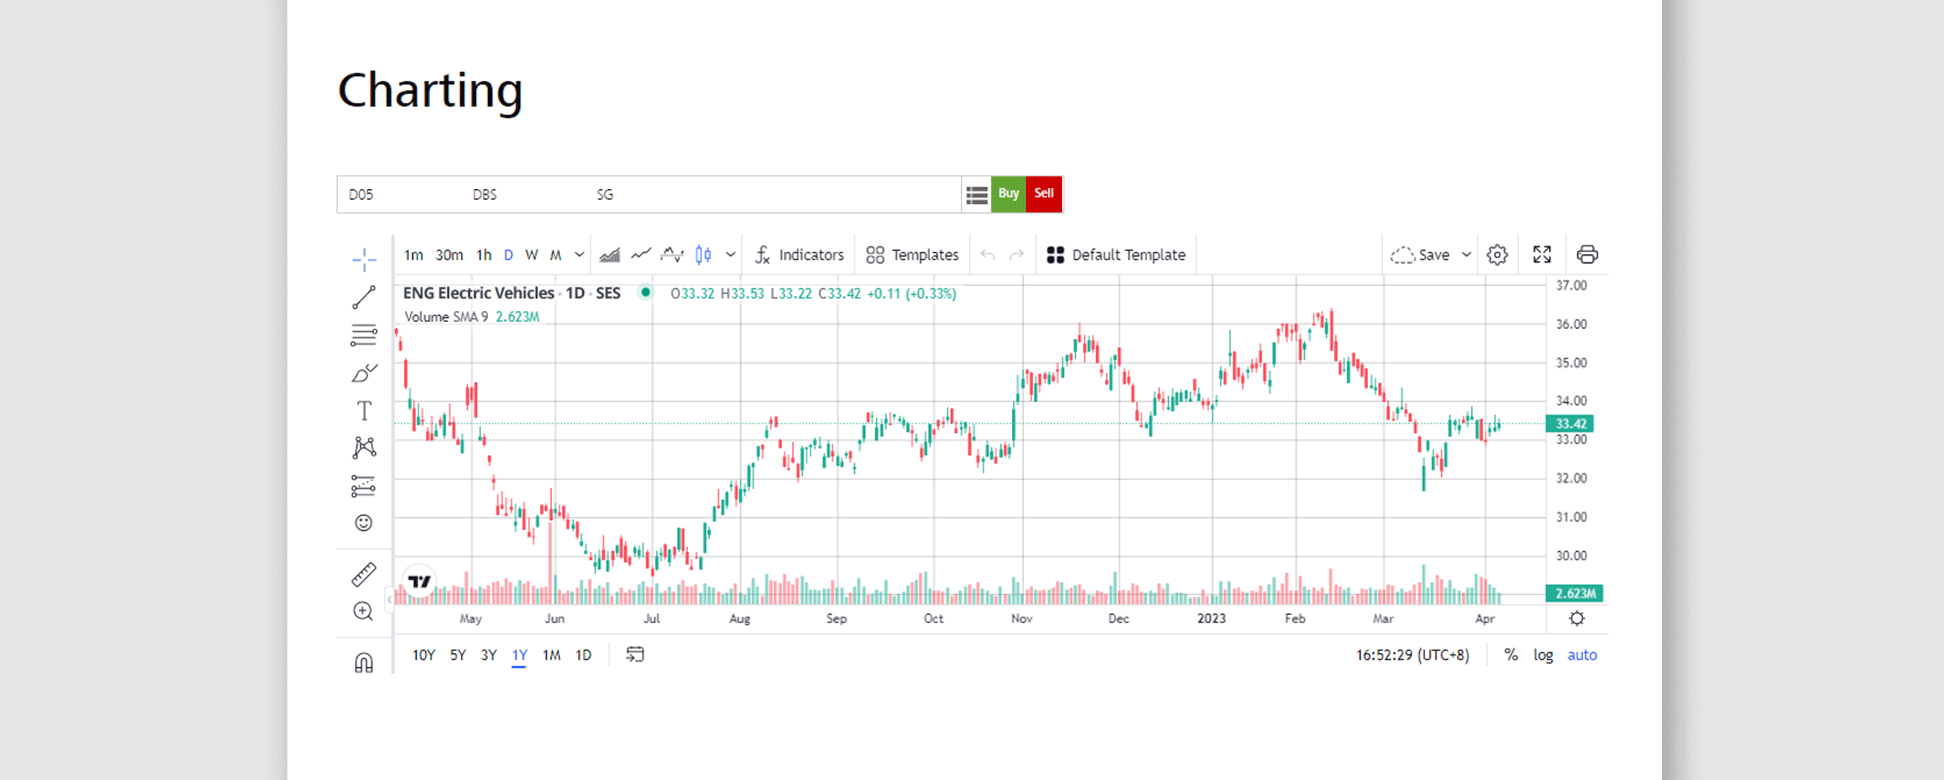
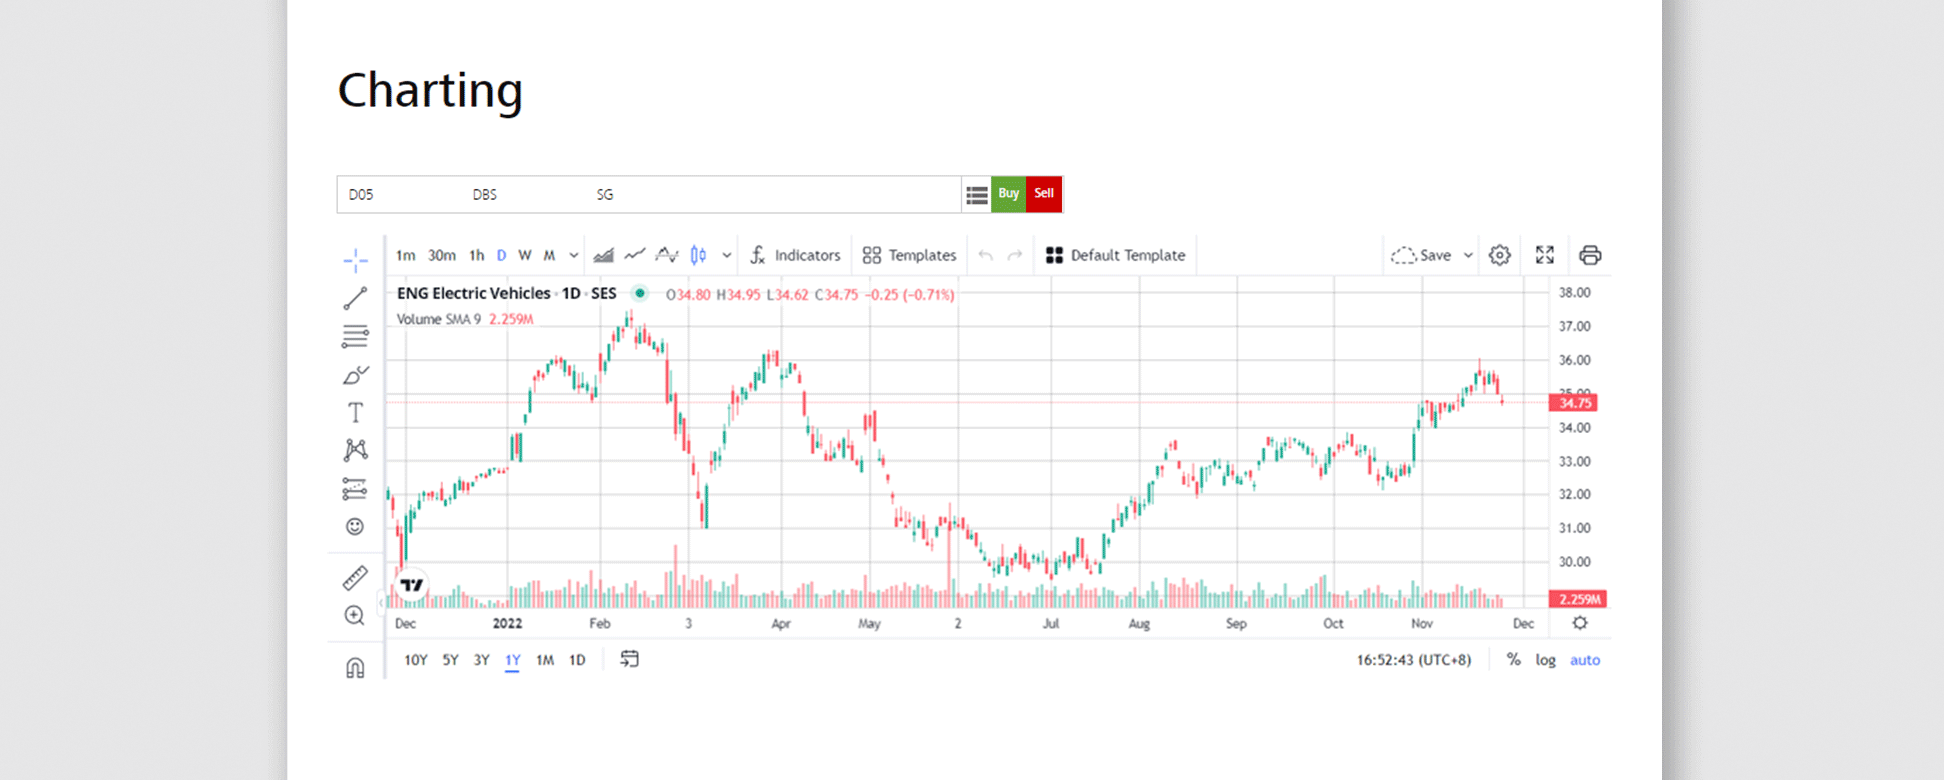
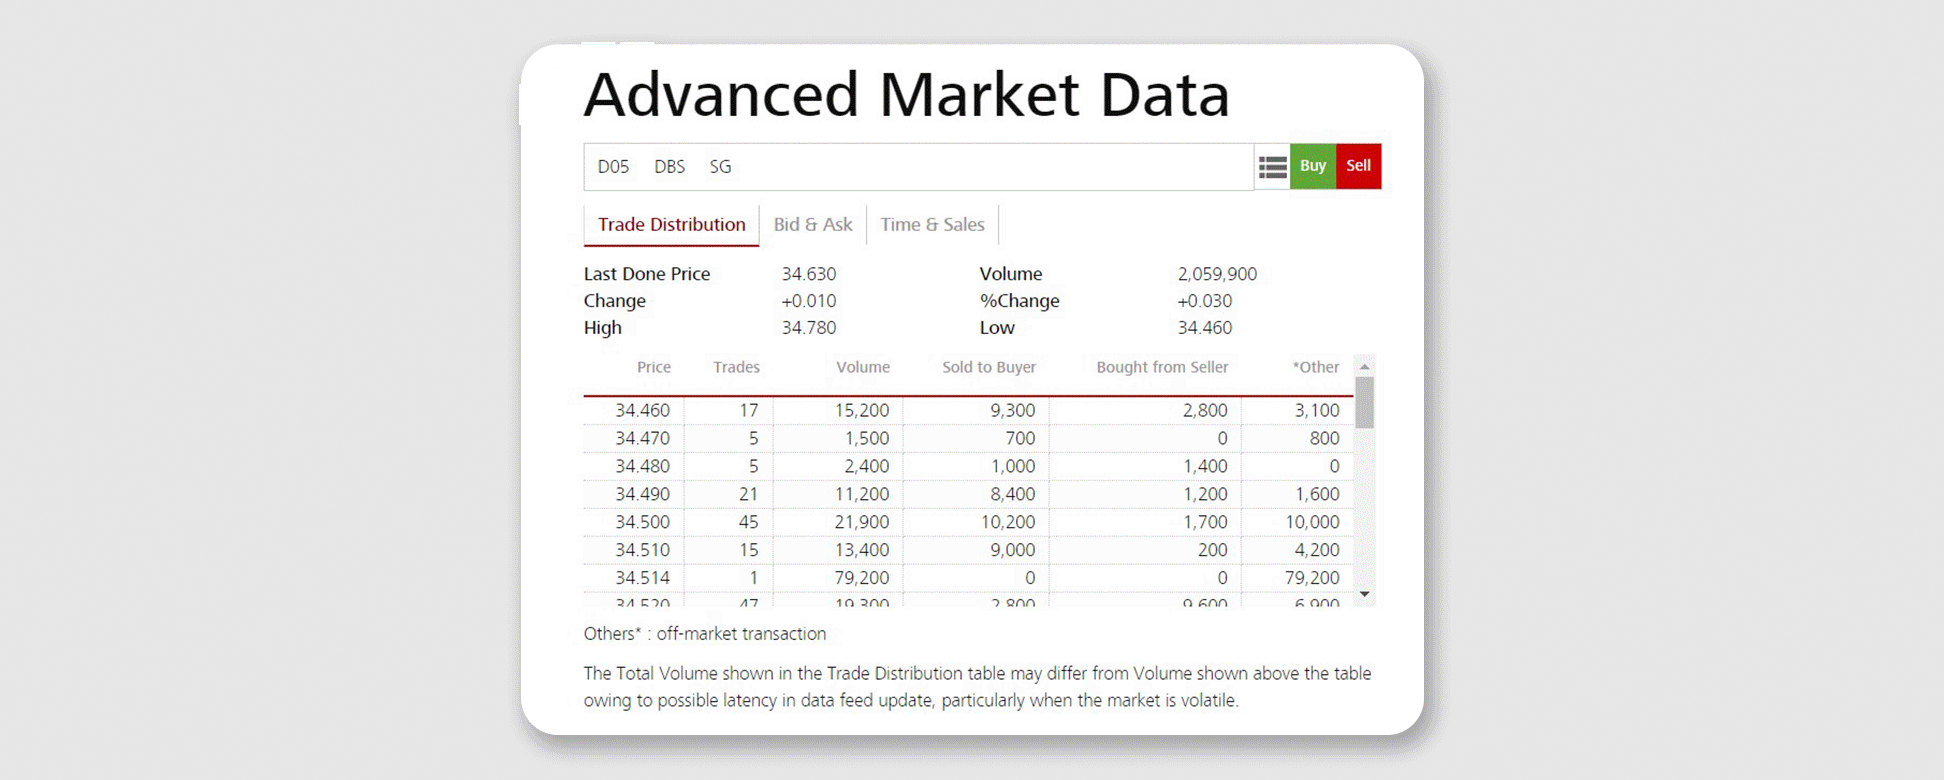
Visualise and assess a stock quickly.
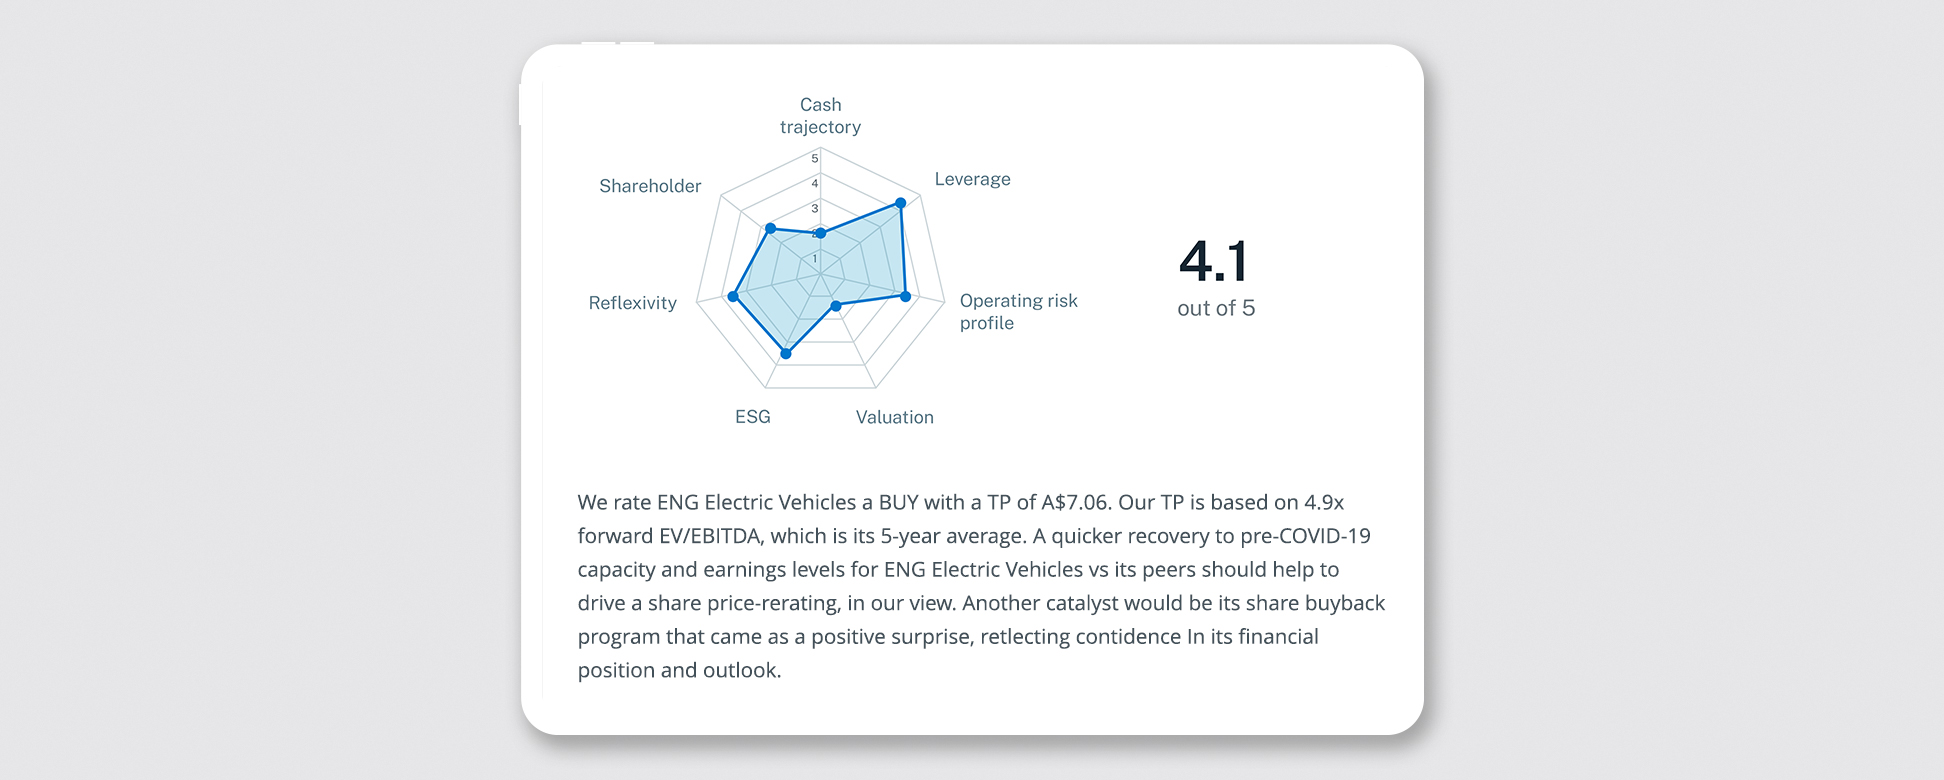
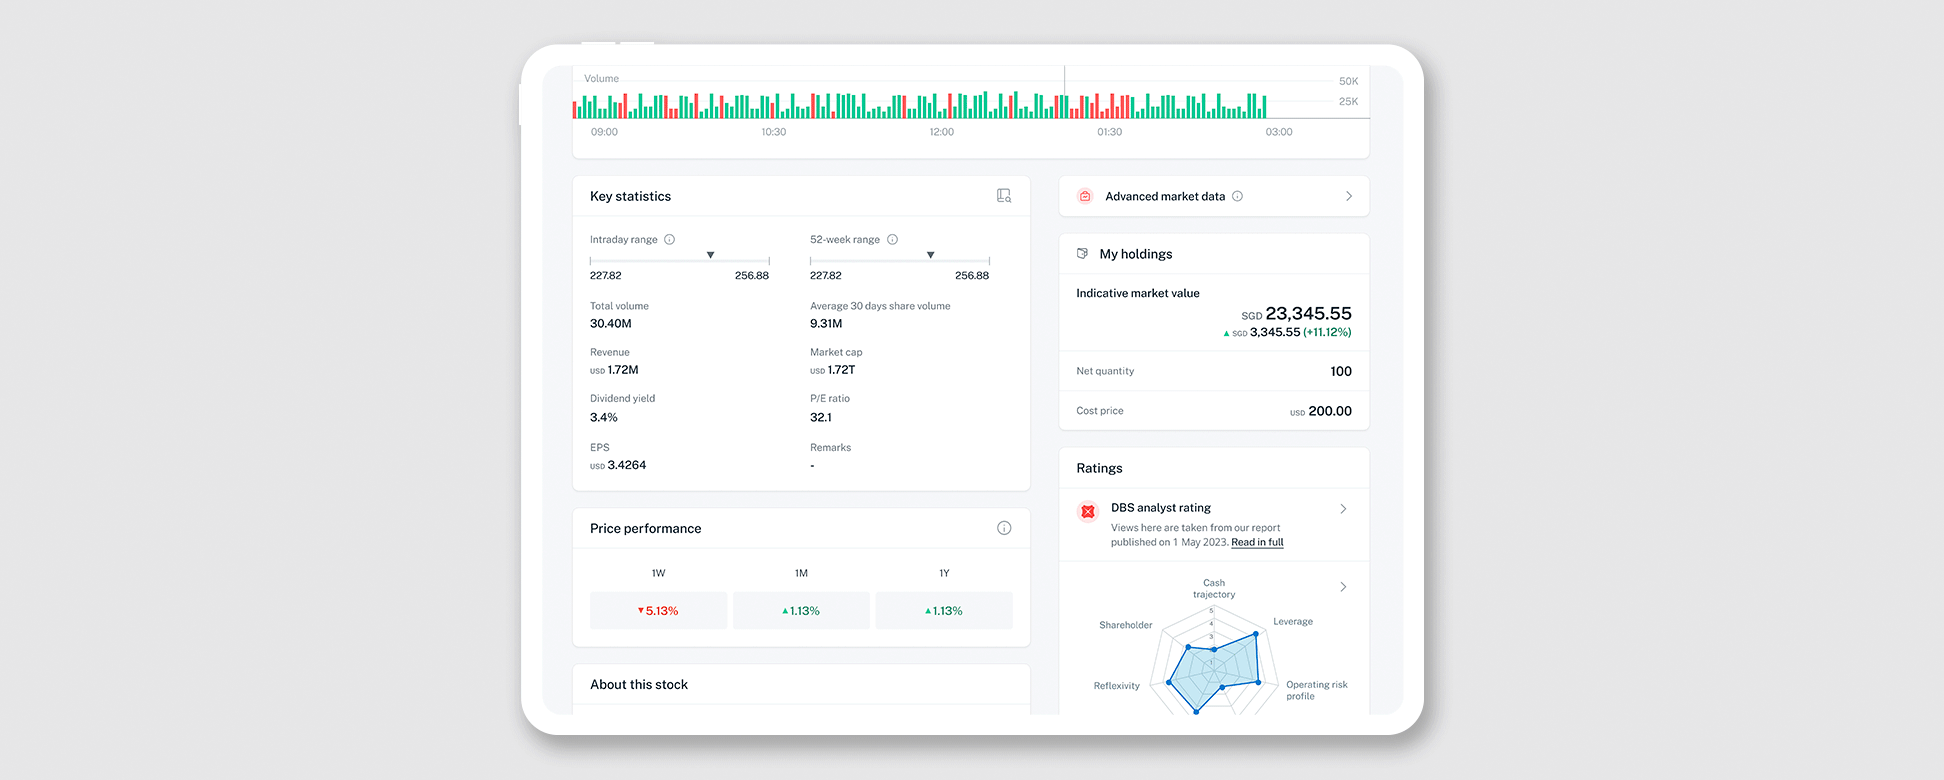
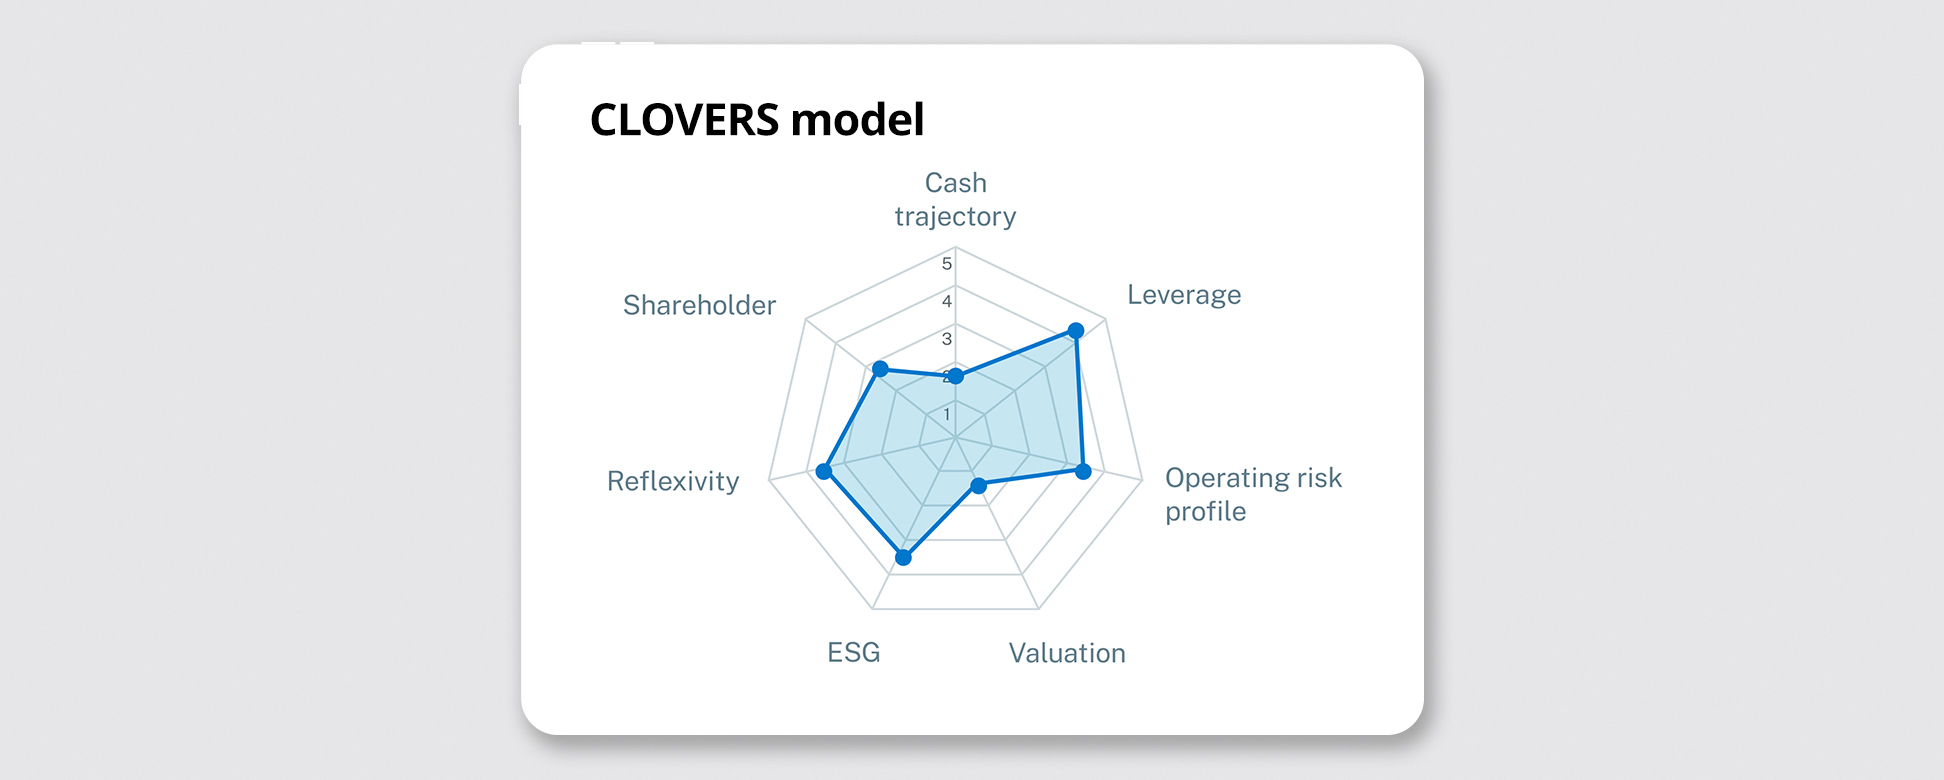
What's in the CLOVERS model?
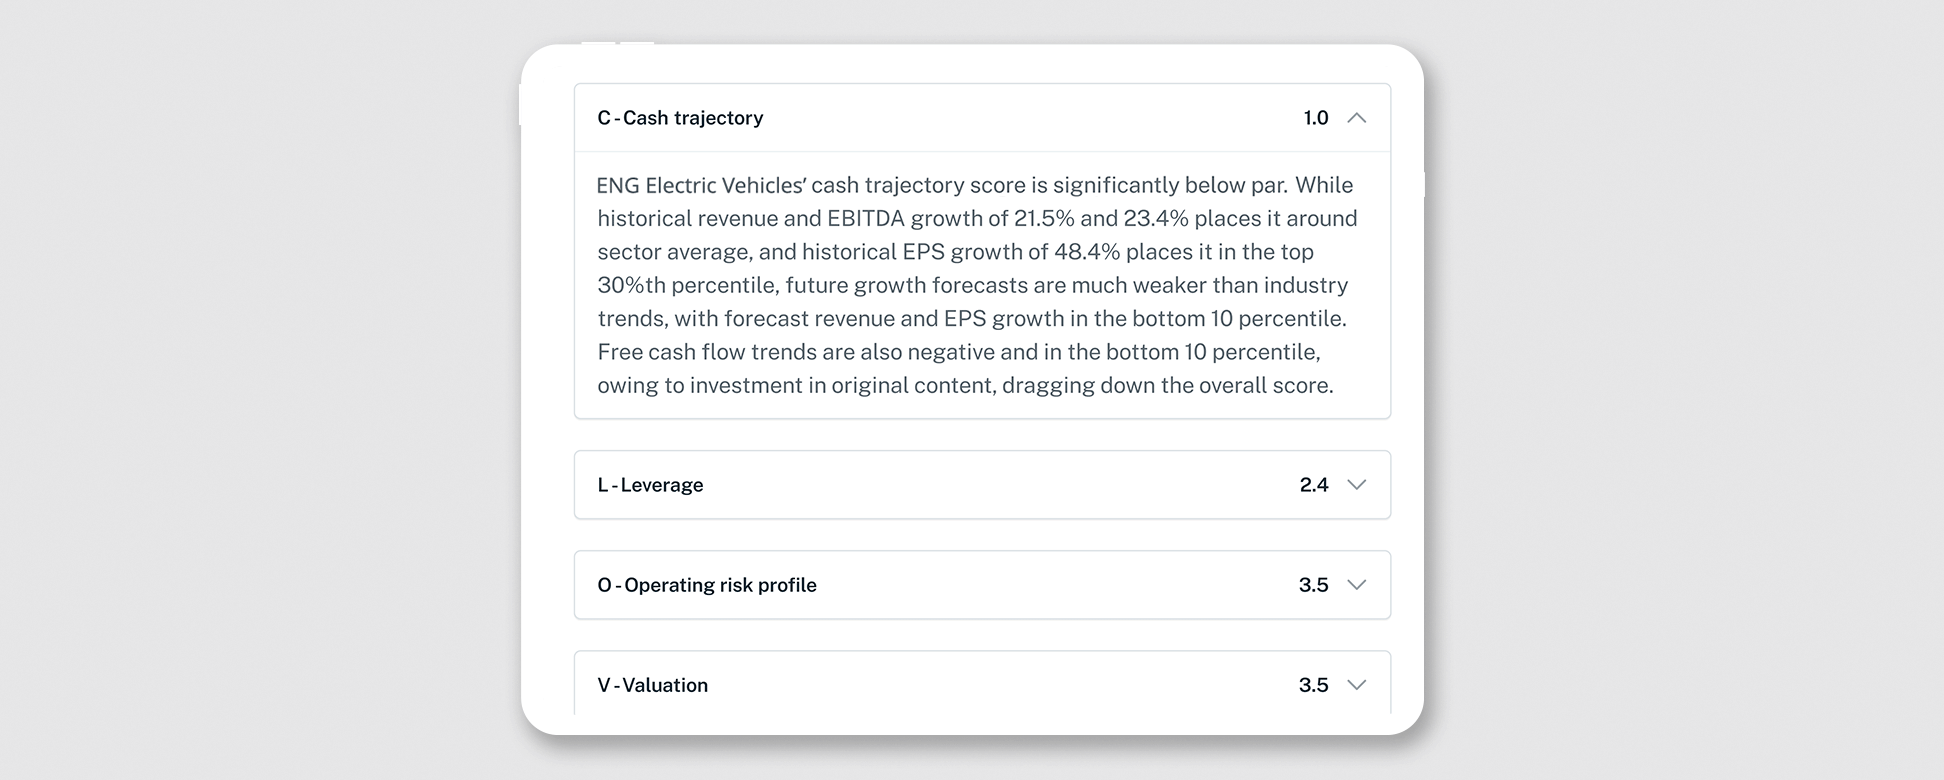
Cash Trajectory
Assess a company's inherent ability to generate free cash flow.
Leverage
Look at a company's ability to cover interest payments and fulfil debt obligations. It also encapsulates a company's liquidity position and capital structure.
Operating Risk Profile
Evaluate the degree of operating leverage present in a company's business model, and the historical volatility of its operating margins.
Valuation
Determine if a company is under- or over-valued, considering its justified valuation relative to fundamentals, and current valuation relative to historical band.
ESG
Understand a company's performance across various ESG barometers given the shift towards sustainable investing.
Reflexivity
Evaluate the sentiment of the market and the street on a company by studying technical indicators, changes in short interests, and revisions to consensus estimates.
Shareholder
Measure a company’s ability to create value for shareholders.